This thread is for the development of AR elements like line graphs and similar interfaces for the openhybird
with the final aim of integrating it into the reality editor as a menu option from which people can select the AR elements
and also the data inputs
reference thread : Creating Unique AR Interface Elements
@valentin i have an idea for implementing the HTML 5 line graph as AR element to show real time values
we can store the the incoming data from the required I/O point to an array which is updated with every incoming data and then redraw the line graph with the updated array every-time the array is updated,
i have begun trying to implement it, waiting for the reality editor to update ![]()
The latest version is still in review. I think it should be public sometime next week.
1 Like
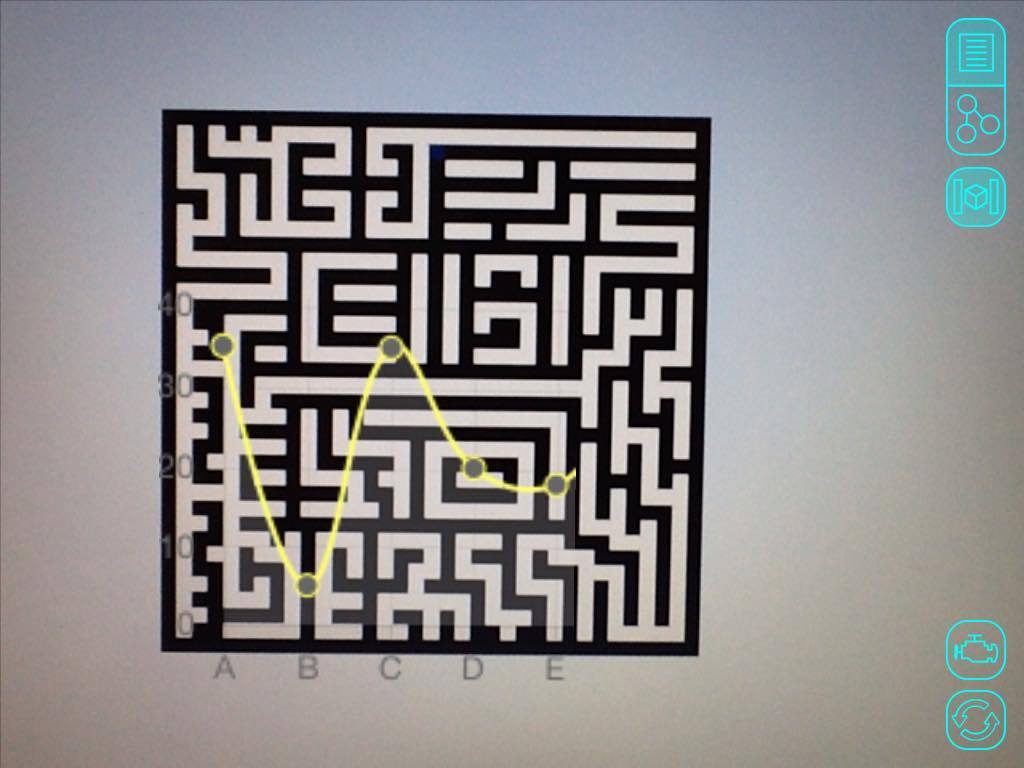
After playing around with HTML for sometime ,finally got a chart with predefined values to get displayed
next step , making the chart update with incoming values by removing some of previous values from beginning of array and adding new values to end of array
UPDATE : now the graph updates dynamically when it is augmented ,
obj.object.on("object", function (msg) {
        var data = JSON.parse(msg)
        if (obj.read("led", data)) {
            slider.value = obj.read("led", data) * 255;
        }
    });

    setInterval(function () {
        sliderValue = slider.value;

        if (!touchState) {
            obj.readRequest("led");
        } else {
            if (sliderPrevValue != sliderValue)
                obj.write("led", sliderValue / 255);

            sliderPrevValue = sliderValue;
        }
    }, 50);
This code gets value from server and updates the value of slider , and also sends back slider value in case we change the value
i only want to receive value from the server,( in my case the value of the sensor ) ,here no input is given from the editor like in case of slider ,i need to update an array with the changing values from the server,
@valentin how can i do this ?
You need to send a obj.readRequest("<your IOpoint>");
If you want it to be updating in realtime, then you need to but the read Request in a loop.
Thats what happening with
 setInterval(function () {

  }, 50);
Watch out that you have a delay (50) between the requests so that the object server is not overwhelmed.
Once the object sees the read request, it will send back the requested IO-point value.
obj.object.on("object", function (msg) {
        var data = JSON.parse(msg)
        if (obj.read("<your IOpoint>", data)) {
            slider.value = obj.read("<your IOpoint>", data) * 255;
        }
    });
The code above is listening (obj.object.on) for incoming data. When the object sends back the data, this function is called.
Replace <your IOpoint> with the name of your IO-Point.
1 Like
@valentin Thanks for the explanation ![]() it worked beautifully , now the line graph updates with real-time values from the sensor , this should do the work that @pcook77 needed
it worked beautifully , now the line graph updates with real-time values from the sensor , this should do the work that @pcook77 needed ![]()
Perfect!
If you want to share your interface, you can create a backup zip file via the developer web interface and post a link to the zip file here. This would allow @pcook77 to directly upload your example zip in to his object via his developer web interface and try out what you created.
Thats the moment this backup and Upload backup functionality has been created for. ![]()
Maybe you guys can work together on refining a good useful interface that can be used in chemistry class rooms all around the world.
1 Like
Yeah! such a system would be awesome , students can just point their device at the apparatus and obtain values in the form of graph or other form directly
i will refine the code a bit more and create backup ![]()
@valentin @pcook77 here is sample video of how it looks (sorry about the bad lighting)
@V_Mohammed_Ibrahim I love it! ![]()
If you print out the marker and pin it close to the sensor, then you can move the iPad around and it would look like the graph is actually part of the sensor. What do you think?
1 Like
yeah ! will try that ![]()