Does the Reality Editor produce some kind of log file? I don’t seem to get my UI elements to talk with the I/O points. I would like to debug that and see if there are some javascript errors or something…
You should be able to remote debug the entire Reality Editor UI via the Remote Debugging tools:
1 Like
Is there some way to “reset” the Reality Editor or more specifically make the Reality Editor reload the object’s files?
There is a reset/reload button for the GUI when you open the reality editor with an iPad.
This will reload the entire interface and all data stored about the objects.
It looks like this: ![]()
I have removed it from the editor on the iPhone so that there is more space.
If you develop on an iPhone, a quick solution would be change line 76 in the onload.js editor file
to being visible. You might also need to make some adjustments with the positioning.
Then host your modified editor copy on a simple local static web server and activate the copy within the reality editor.
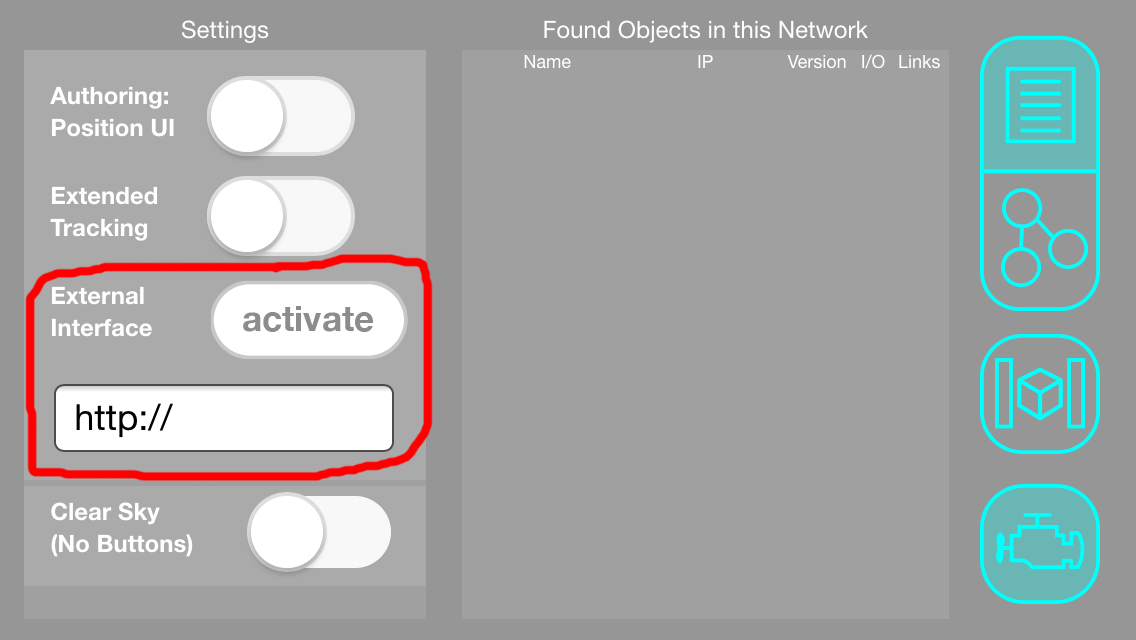
Once you activate the interface from your own URL or IP, the interface is loading from your own code. The editor will load your own code every time you open the app for as long as your own code is reachable. It will fall back to the default interface if it was unable to load the copy from the remote server.
In any case, if your editor is not seeing the object target for 3 seconds it destroys the buffered web page and fully reloads it from the hybrid object when it is visible again. However this will not destroy the json data known about the object.
1 Like
Now that I’m trying to debug the RealityEditor itself, I’m running into some trouble. Since I’m on Windows I’m trying to use jsconsole.com and I’m adding the script tag to the head of the editor’s index.html. It doesn’t work and I have no idea as to why.
When I add the same tag to my WebUI element it works like a charm, but obviously then I only get the console output of my WebUI and not of the RealityEditor.
Any ideas on how to debug the RealityEditor itself?
With osx you can use the safari developer functions for debugging.
Thats very much straight forward.
I have no experience with jsconsole.com.
A small side note:
I have made some deep changes to how the editor communicates with the iOS app for the next update (waiting for approval). This could lead to errors or prevent javascript from execution.
But the fork that you use (according to github) should work as expected.
Yeah, unfortunately I don’t have a Macbook or any other OSX device.
Yes, I’m not on the master branch because it still seemed to be buggy and I ran into some troubles, so I decided to work with the 1.5.3 branch for now. Hm, I think when I first worked with it, I managed to get some debug output, but I can’t remember how I managed to do that anymore ![]()
I also implemented a onscreen debugging interface, as I found it cumbersome to always load an external interface.
You can find its content in the log.js file.
The log button for access is hidden (logButtonDiv) but still present.
You can make it visible in onload.js L75.
Maybe this can help you.
Ah, ok, it seems to be something else. Maybe my Webserver caches the files or something. I just tried to change something obvious but it’s still loading an earlier version.
Ok, nevermind, it was some weird caching. jsconsole works now. Thanks anyways.
@valentin I’m trying to debug my UI in RealityEditor using Safari, but I get “No Inspectable Applications” when I run reality editor with interface for target on.
I do see application when I’m running the native Safari application on iOS. Do you have any ideas why this is not working?
Thanks,
Jacob
Hi @ejactho,
maybe @Carsten has a solution for that?
He did a lot of external development on the editor and must have had a debugging workflow of some sort.
I believe since iOS 9 the Safari WebInspector does not show up with the app store version.
It only shows up when you compile the app on the same computer where you use the inspector.
Maybe there is some kind of compiler flag that we can set?
We will research that a bit more. Let me know if you find some solution.
Hi @valentin,
we are trying to debug the user interface
taught there is no iOS source code we have to debug the external interface but
on our iPhone 6 (iOS 10.2.1) the external interface doesn’t seem to load.
We have changed some bit of text just to try.
Any solution is welcome,
thanks for your support.
Alessio
Hi @alessiocamillio,
I can think about to solutions here:
- At the external interface text field, have you typed in the entire URL with http:// in the beginning?
- The external interface has a couple of synchronization calls with the iOS App.
If your user interface has javascript errors that prevent your UI from executing these synchronization calls, then your user interface will not be loaded.
Is it something you can share? I could have a look at it.
Hi @valentin,
about your two solutions:
-
we typed the url of external interface including http://
-
actually we have tested your GitHub editor and we haven’t changed anything.
Our javascript console is clean.
Is it necessary to have a UDP broadcast network just to test an external interface?
Is it feasible to have access to client source code (of Reality Editor app)?
Thanks for your support,
we are looking forward to receive your reply.
Alessio and Stefano
Dear @valentin
we have successifully debugged the “editor App”
using a Safari webpage on Iphone and web inspector console on MacOS but
- using the “editor app” like a safari webpage, we are not able to use the camera as well.
- we are not able to debug the “editor app” when it is used
as external interface within Reality Editor IOS App. - Can you point us out where in the code we can find the right method called just after the thumb release on the second iopoint? (in the iopoint connection ui)
We think that the right method resides in eventhandler.js,
Stefano and Alessio
P.S. “editor app” is the editor available at the following url: https://github.com/openhybrid/editor
- the “editor app” is GUI and http networking only. The tracking is performed native.
- search the forum for console support. I remember there was another discussion about it.
- I do not understand what you have in mind. what is “thumb”? Methods called for what?
sorry @valentin
for my unclear question:
3. Using Reality Editor, in the IOPoints UI, the method called when the user
connects one iopoint to the second one
thank you for the reply
Stefano aka Steve