I’m looking for suggestions on how to construct custom interface elements for use with open hybrid projects. I have little coding experience, and would like to create interfaces for my students to use with lab probeware to display values obtained during experiments (I’m a chemistry teacher). Any suggestions or process related tips would be greatly appreciated.
Do you know some web projects that do data visualization similar to what you have in mind?
You are able to use every UI element that you can find in the web for building openhybrid UI elements.
Do you have students that know some html/javascript/jquery?
If you have some idea what it should be doing, maybe you can sketch a general idea what these interfaces should be able to do.
Maybe we can collaborate and build some basic building blocks so that people like you with little experience in web coding will still be able to make good use of the platform? Maybe we come up with interfaces useful for many other chemistry teachers?
I’ll do some searching, but I don’t know how many of my students will have experience with html/javascript/jquery (classes don’t start for us until Sept. 8th). I would like to learn how to construct these elements myself, as I see the utility in open hybrid as being a means for students to quickly visualize data using their mobile devices and record values for later analysis.
Here’s what I would like to build, where sensor 1 and sensor 2 would be common probes used within the chemistry classroom (such as a temperature probe and pressure sensor).Heres the link to a sketch of the AR interface.
That looks very simple and I see the use-case.
It would be good if there would be some kind of graphical widgets that you can just drag and drop on to your object.
I would like to see if I can find some help to get such a widget idea started in the media lab as a student semester project.
In the Meantime you can use the following to live update a webpage element (like
) with the readings from the arduino:
var container = document.getElementById(id);
container.innerHTML = content;
Whereby content is the reading that comes from the arduino.
You would place this code where the demo updates the slider, for whenever there is new data.
Second you should look in to html5 canvas.
You can find some step by step example here:
http://www.worldwidewhat.net/2011/06/draw-a-line-graph-using-html5-canvas/
Thanks Valentin! I’ll get started straight away!
@valentin that is a good idea if you had a drag and drop widget to select what you want to augment
i was able to edit the slider example to make two different sliders reflecting values from two different IR sensors and controlling two LED’s
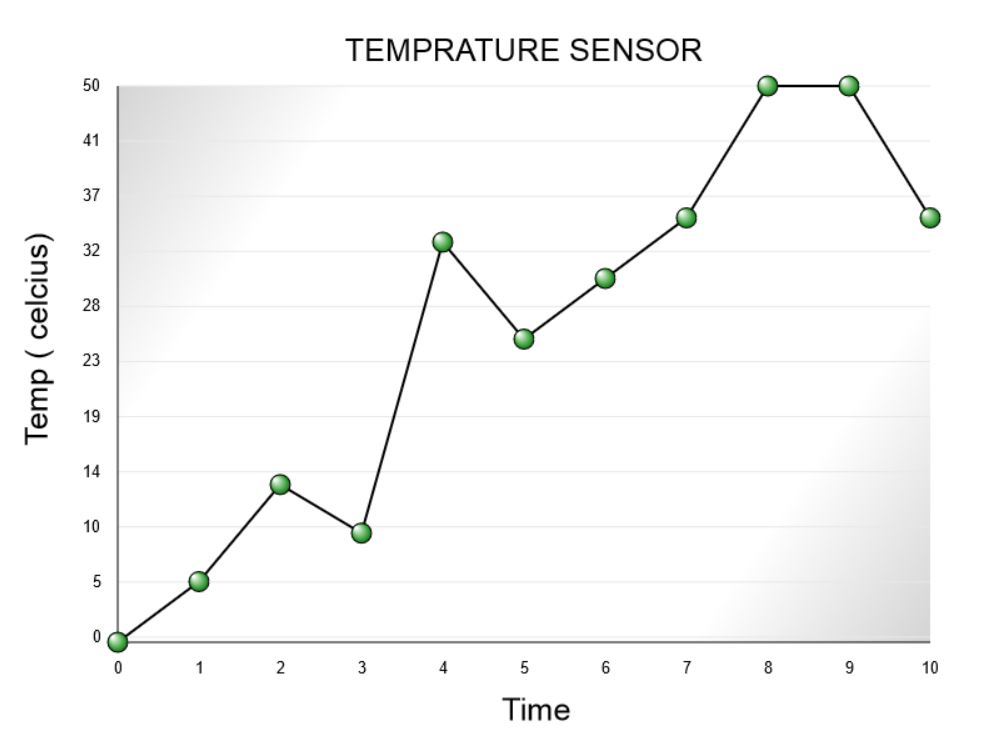
i assume he wants a graph like this to be augmented and updated in real time ![]()
@pcook77 did you had any success so far?
Maybe @V_Mohammed_Ibrahim and you can help each other on this.
hi @valentin
To implement the line graph i think, we can store the values from the sensors at a fixed interval to an array or use two set of variables maybe and then use that values to plot the points for the line graph,